Tuesday, March 16, 2010
Break/Stop a running matlab process: Ctrl + C
I used this to break a dead-end loop long time ago and then forgot about it. It's good a trick to remember.


Friday, February 26, 2010
Some good blog posts
I ran into a blog yesterday, which is a very good source for Matlab fans. And i found some posts are really useful.
This one tells you how to better manage the memory:
http://obasic.net/preallocate-before-you-loop-it-in-matlab
This one shows how to conveniently set up the interface and default settings by using startup file.
http://obasic.net/set-your-customized-startup-file-for-matlab
Though some of them are geeky:
Twitter from Matlab?
http://obasic.net/how-to-twitter-from-matlab
Sending email using Matlab?
http://obasic.net/how-to-send-e-mail-from-matlab
Anyway, very nice job.
This one tells you how to better manage the memory:
http://obasic.net/preallocate-before-you-loop-it-in-matlab
This one shows how to conveniently set up the interface and default settings by using startup file.
http://obasic.net/set-your-customized-startup-file-for-matlab
Though some of them are geeky:
Twitter from Matlab?
http://obasic.net/how-to-twitter-from-matlab
Sending email using Matlab?
http://obasic.net/how-to-send-e-mail-from-matlab
Anyway, very nice job.
Saturday, February 20, 2010
how to calculate payments on a loan using MS Excel?
Excel has lots of useful built-in functions, and PMT is one of them that can calculate payments on a loan for you. Here is a simple example:
And here is how to do the calculation:
Input following into any cell of a Excel worksheet:
The value shown in the cell ($156.68 ) is the money I am going to pay to the bank each month. Here 0.08/12 is used because the 8% is annual rate, so divide it by 12 to get the monthly rate. And in 3 years, there are 3*12 months, which means the number of payment is 36.
Then, what is the total I pay to the bank? As you might have guessed, it is $156.68*36 (=$5640.55). So the bank will earn $640.55 in this deal at the end. Well, that is a lot of money. Now I am thinking about how to own a bank...
P.S: If you didn't buy MS Excel, that's OK! The Google Docs spreadsheet will do the same thing for you! It is right here: docs.google.com
P.S: this has nothing to do with Matlab, but it is still interesting (at least to me) and useful.
If I get a loan of $5000 from a bank, with the annual interest rate of 8%, and I am supposed to pay it off in 3 years, how much should I pay (OR they will ask me to pay) each month?
Input following into any cell of a Excel worksheet:
=PMT(0.08/12, 3*12, 5000)
and press Enter.The value shown in the cell ($156.68 ) is the money I am going to pay to the bank each month. Here 0.08/12 is used because the 8% is annual rate, so divide it by 12 to get the monthly rate. And in 3 years, there are 3*12 months, which means the number of payment is 36.
Then, what is the total I pay to the bank? As you might have guessed, it is $156.68*36 (=$5640.55). So the bank will earn $640.55 in this deal at the end. Well, that is a lot of money. Now I am thinking about how to own a bank...
P.S: If you didn't buy MS Excel, that's OK! The Google Docs spreadsheet will do the same thing for you! It is right here: docs.google.com
P.S: this has nothing to do with Matlab, but it is still interesting (at least to me) and useful.
Linear least-square regression
Of course, the linear least-square regression is an easy thing to do in Excel. Just adding a linear trend-line to the plot will do that for you. Anyway, I wrote this piece of code to do it in Matlab.
% Single least-square linear regression
%Created on 02/17
x=input ('x='); %use [] to input a row
y=input ('y='); %use [] to input a row
X=mean(x);
Y=mean(y);
beta=(sum((x-X).*(y-Y)))/sum((x-X).^2);
alpa=Y-beta*X;
Equation=strcat('y=',num2str(beta), 'x+',num2str(alpa))
The num2str function was used to convert the beta and alpa, which are numbers, into strings.
The strcat function was used to concatenate the strings.
% Single least-square linear regression
%Created on 02/17
x=input ('x='); %use [] to input a row
y=input ('y='); %use [] to input a row
X=mean(x);
Y=mean(y);
beta=(sum((x-X).*(y-Y)))/sum((x-X).^2);
alpa=Y-beta*X;
Equation=strcat('y=',num2str(beta), 'x+',num2str(alpa))
The num2str function was used to convert the beta and alpa, which are numbers, into strings.
The strcat function was used to concatenate the strings.
Monday, February 15, 2010
Give curves random color, just for fun
A few days ago, I drew some curves on a same plot. And now I want to randomize the curve color.
Because the color syntax can be expressed as letters such as k, g, b etc. and also as a three element row, which indicate the RBG mode, such as [1, 0, 1], [0.1,0.7, 0.4] and so on.
So here I wrote a M-file to randomize the color and plot 10 curves in each subplot.
%this code produce a three element row
%which can be used to specify a random color
%created on 02/15/2010
function rndclr=f()
rndclr=[rand, rand, rand];
%this code draws some curves
%of random color
clf
t=0:0.01:100*pi;
for j=1:9
for i=1:10
hold all;
x=(i+2)*cos(t/i)+cos((i-1)*t);
y=i*sin(t/i)+sin((i-3)*t);
subplot (3,3,j);
plot(x,y,'color',rndclr)
axis('equal')
axis off
end
end
And here is the figure:
Because the color syntax can be expressed as letters such as k, g, b etc. and also as a three element row, which indicate the RBG mode, such as [1, 0, 1], [0.1,0.7, 0.4] and so on.
So here I wrote a M-file to randomize the color and plot 10 curves in each subplot.
%this code produce a three element row
%which can be used to specify a random color
%created on 02/15/2010
function rndclr=f()
rndclr=[rand, rand, rand];
%this code draws some curves
%of random color
clf
t=0:0.01:100*pi;
for j=1:9
for i=1:10
hold all;
x=(i+2)*cos(t/i)+cos((i-1)*t);
y=i*sin(t/i)+sin((i-3)*t);
subplot (3,3,j);
plot(x,y,'color',rndclr)
axis('equal')
axis off
end
end
And here is the figure:

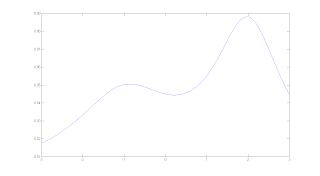
M-file, single-variable function integration and boundary on fixed interval
%This is a simple f(x) function
function y =bumpy(x)
%this function draws a bumpy curve
y=1/(4*pi)*(1./((x-2).^2+1)+1./((x+0.5).^4+32)+1./((x+1).^2+2));
%This is how to integrate the function on (-3,3), with tolerance of 10^(-6)
quad('bumpy', -3, 3, 10^(-6))
%This is how to find the minimum boundary of x and y, on (-1.2, 1)
xmin=fminbnd('bumpy',-1.2, 1)
ymin=bumpy(xmin)
%How to find the maximun boundary?
%find minimum boundary for y=-f(x)
%This is example is from Introduction to Matlab with numerical preliminaries by Alexander Stanoyevitch.
function y =bumpy(x)
%this function draws a bumpy curve
y=1/(4*pi)*(1./((x-2).^2+1)+1./((x+0.5).^4+32)+1./((x+1).^2+2));
%This is how to integrate the function on (-3,3), with tolerance of 10^(-6)
quad('bumpy', -3, 3, 10^(-6))
%This is how to find the minimum boundary of x and y, on (-1.2, 1)
xmin=fminbnd('bumpy',-1.2, 1)
ymin=bumpy(xmin)
%How to find the maximun boundary?
%find minimum boundary for y=-f(x)

%This is example is from Introduction to Matlab with numerical preliminaries by Alexander Stanoyevitch.
Subscribe to:
Posts (Atom)